
Most people have a budget in mind when they spend money. But people in different cities tend to spend in different ways. For example in New York, the population density means high housing costs, but the availability of public transportation means that people can save money on getting around the city. Below we analyze what Americans spend the most on.
Check out the best credit cards of 2017.
We analyzed spending data for 16 of the biggest cities in the U.S. from the BLS Consumer Expenditure Survey. We compared each city according to how much the average household spends on things like food, housing, transportation and more. Check out our data and methodology below to see where we got our data and how we put it together.
Key Findings
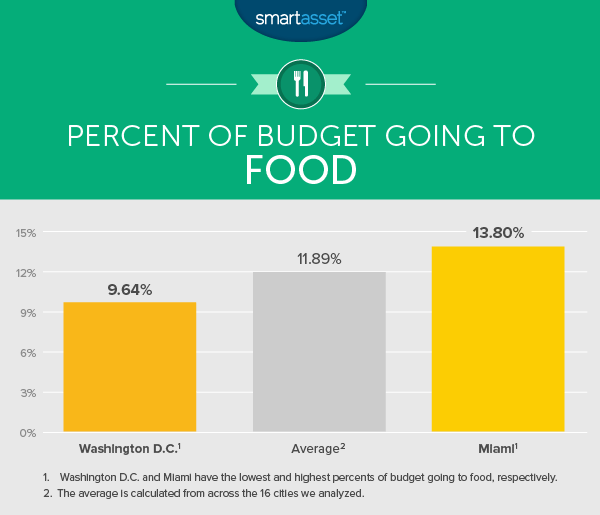
- Higher-earning households spend less on food – You may expect that as incomes rise people spend more money. This is true in many categories but food is not one of them. For the most part as the size of budgets rise, the portion of the budget dedicated to food shrinks. For example, people in Washington, D.C., the city with the highest median household income in the study, spend around 9% of the average budget on food, the lowest portion in our study. Miami, the city with the lowest median household income in the survey, spends 13% of the average budget on food.
- Majority of budgets go to housing and transport – In every city we analyzed, housing and then transportation ate up the largest chunks of the average household’s budget. These two items ate up around 50% of the average budgets. But there were big differences in how each city split that 50%. In Houston, the breakdown was 20% of budget spent on transportation and around 32% on housing. In New York, it’s around 12% on transportation and 40% on housing.
- Largest differences come in discretionary spending – There are certain essential spending categories like housing, food and transportation. In discretionary categories – think things like reading, alcohol and tobacco – we saw the largest differences in spending. For example, the average Baltimore household spends 250% more on reading than the average Miami household does. This translates to a difference of about $200 per year.
Chicago
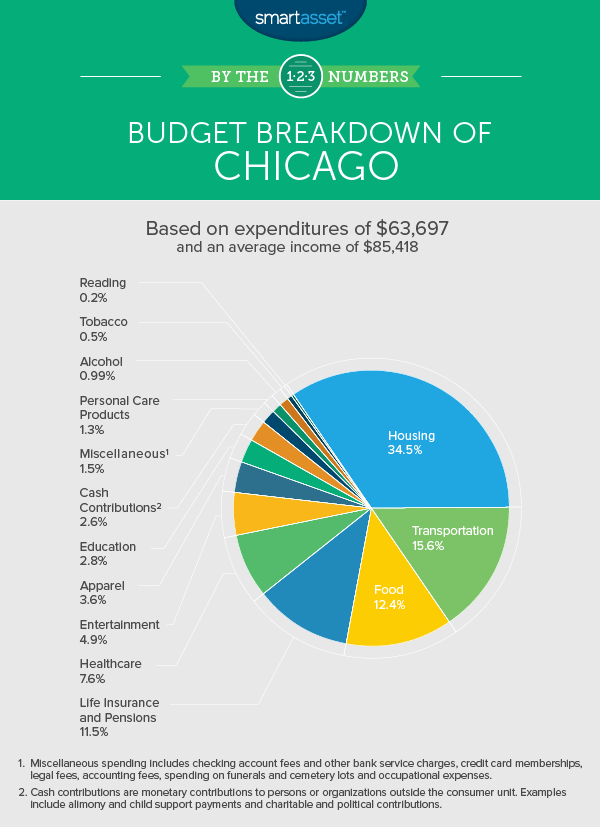
The largest chunk of the average Chicago household’s budget goes to housing. About 34% of the budget is spent on that category. For that figure Chicago is about average, ranking ninth out of the 16 cities we analyzed. The average Chicago household spends the fourth-largest percent of its budget on education and tobacco relative to other cities. Both of those categories make up a fairly small portion of the budget, only about 3.3% in total.
Chicagoans spend among the least, relative to other cities, on what the Bureau of Labor Statistics calls cash contributions (about 2.56%). This metric includes cash contributions to any person or organization which is outside of the household unit. So, this can include donations to religious or political organizations or it can include payments made to support children in college, for example. Overall Chicago ranked 14th on percent of budget going to cash contributions.
New York
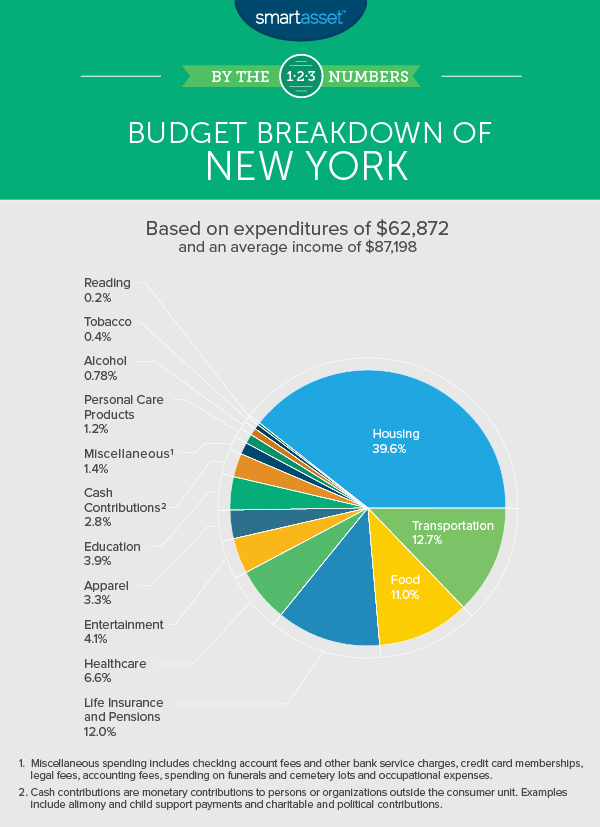
In some ways New Yorkers’ spending is the opposite of Houston residents’ spending. New York resident put an enormous amount of their budget into their homes – almost 40% on average – while spending as little as possible on transportation, just 12%, on average. But transportation and housing tend to be linked, cutting back in one leads to spending in the other. For example, when you combine percent of budget spent on housing and transportation, our data shows that New York and Houston are actually very similar. Residents in both cities spend around 52% of their total budgets in those two categories on average.
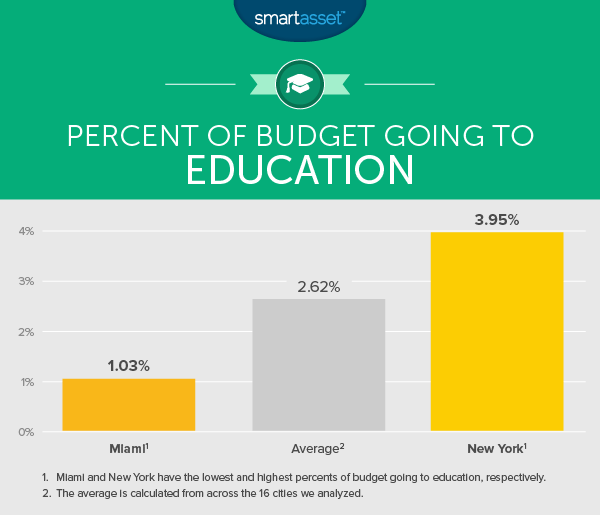
New York metro area residents also spend more on education than any other city. Overall residents in New York spend an average of 3.95% of their budget on education, or about $2,500 per year. Education costs include tuition and fees for any kind of schooling, textbooks and other education-related accessories.
Miami
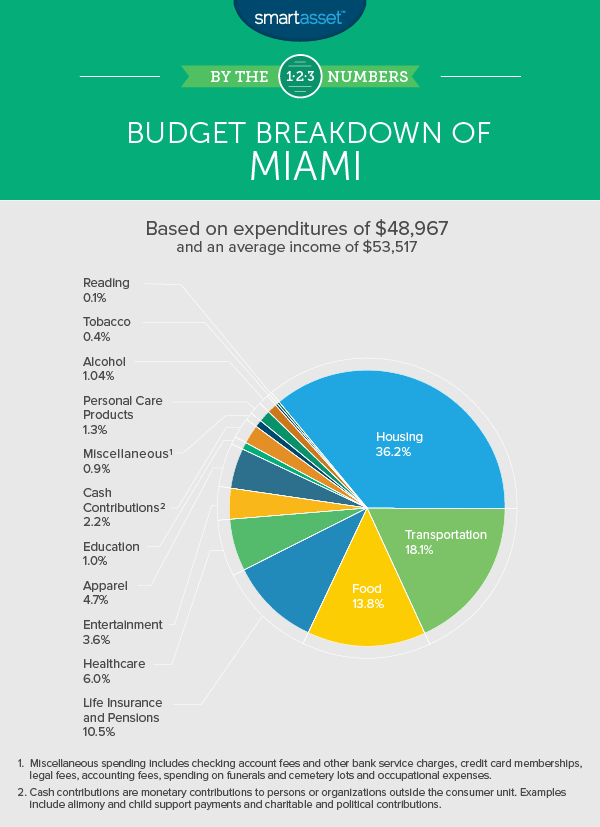
According to our data, Miami residents are the lowest earners in the study on average. The households sampled for the BLS Consumer Expenditure Survey had an average household income of $53,500 and average expenditures of $48,967. That’s about 50% less than households in other cities earn. This means necessities tended to dominate the budget in Miami. Average Miami households spend a larger chunk of their budget on food and apparel than any other city in our study, for example. Miami households also tend to spend more on housing and transport, two other necessities. For those metrics, Miami ranked fifth and third.
With all of those categories taking up large chunks of their budgets, cuts had to come from somewhere. In particular spending on entertainment, reading, healthcare and education all took a hit. Miami ranked last in spending on each of those categories.
Detroit
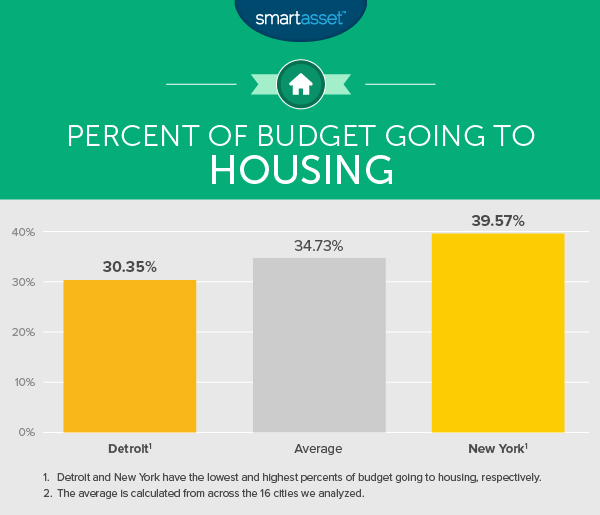
Detroit residents take advantage of some of the lowest housing costs in the country. Overall average households here spends 30% of their budget on housing, less than any other city we analyzed.
That leftover money from housing tends to go to two budget items: entertainment and transportation. Average households spend almost 6% of their budget on entertainment (the highest in the study) and almost 19% on transportation (the second-highest in the study). The BLS considers a wide range of expenditures as part of entertainment, including going to concerts, buying equipment for your favorite hobby or even taking your pet to the vet.
Houston
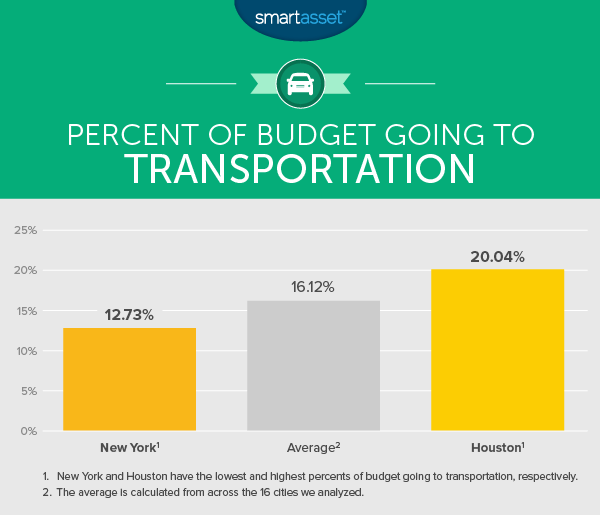
If you are moving to Houston, get ready to spend a lot on getting around town. Overall Houston residents spend more than any other city on transportation costs, an average of $13,462 per year which is about 20% of their overall budget. Most of those transportation costs ($6,468) come from vehicle purchases with another large chunk coming from gasoline and motor oil expenses.
Households here might be able to budget more for transportation thanks to the low housing costs in the area. Residents here only spend about 32% of their income on housing, the third-lowest rate in our study.
Washington, D.C.
No one spends as much on cash contributions as D.C. residents. Spending on cash contributions, as you may recall, includes contributions to polical organizations. Given that Washington, D.C. is the hub of political activity in this country it isn’t too surprising they lead the way in that category.
D.C. residents, according to BLS data, are also big readers, or at least big spenders on reading. They spend the second-highest percent of their budget on books, magazines and other reading expenditures, on average. In general, households here tend to spend less on food, apparel and entertainment. For both the food and apparel categories, D.C. households ranked last for average amount of budget spent.
Minneapolis-St. Paul
Compared to other metro areas, Minneapolis-St. Paul residents don’t spend much on housing or apparel. The Twin Cities ranked second-to-last in both of these metrics, spending 32.2% of the average budget on housing and 2.82% on apparel.
Instead households put a larger chunk of their budget toward reading, education and personal care. In each of those three metrics, Minneapolis-St. Paul ranked third in the study. One interesting thing to note is that Minneapolis-St. Paul residents spend almost three times as much on reading, including books and magazines, as residents in Miami do.
Los Angeles
It may not be surprising, given that Los Angeles is home to Hollywood, to learn that L.A. residents spend an average of almost 5% of their budget on apparel. Only Miami spends a larger percent of its budget on that category. Due to high housing costs in the area, L.A. residents also fork over an average of 37% of their budget to housing costs. These costs include mortgage or rent, as well as utilities and upkeep.
Los Angeles residents seem to be frugal spenders when it comes to transportation. This may be surprising given that Los Angeles is known for having some of the worst, gas-guzzling traffic in the country. Residents in Los Angeles spends an average of about 15% of their budget getting around the city. That’s the 13th-lowest percentage in our study. In comparison, Houston residents spend an average of 20% of their budgets on transportation.
San Francisco
On average residents in the Bay Area spend just over 37% of their total budget on their homes. Of the $71,000 the average household spends per year, about $26,000 goes to housing. San Francisco residents also spend a larger chunk of their budget on alcohol than any other city in our data set: 1.4%, or about $1,000 per year.
In order to spend more on alcohol and housing, households here cut back their spending on items like transportation and tobacco. San Francisco residents spend the lowest amount on tobacco products (0.19% of the overall budget) and the second-lowest on transportation (13.8% of the overall budget).
San Diego
The average San Diego household spends more on personal care than any other city we analyzed. Personal care products include items like hair products, shaving products and cosmetics. We should point out though that personal care product spending in San Diego makes up only 1.36% of the average budget.
Residents here also spend more than average on entertainment (5.26% of overall budget, fourth-most overall) and housing (35.85% of overall budget, fifth-most overall). San Diego residents tend to cut back on items like food, tobacco and education. For those three categories, the average San Diego household spends less than households in other cities.
Seattle
Overall residents in Seattle seem to be having a good time. They spend the third-most on food, the fourth-most on alcohol and the second-most on entertainment. The average household in Seattle spends over $3,600 on entertainment per year. But of course, in order to fit that into their budget something has to give. Budget cuts come in housing, transport and healthcare. Seattle households spend less than average on each of those categories.
Seattle residents also spend the most on what the BLS calls miscellaneous items, which includes things like credit card fees and bank account fees. Overall Seattle households spend over 2.8% of their budget per year on this category on average. That’s 270% more than the average Atlanta household, which spends the least. Of course, spending a lot on credit card fees is not always a bad thing. Some of the best rewards credit cards come with relatively high annual fees. For the Seattle households who do want to lower their annual fees, there are also some great no fee credit cards out there.
Phoenix
In the past we have shown that many retirees are choosing to move to the Phoenix area. Phoenix residents spend more on healthcare than any other city in the study. Over 8.1% of the average Phoenix household’s budget goes to healthcare. Healthcare costs includes the cost of insurance and medicine. Residents in Phoenix also spend more than average on food and alcohol. For both of those metrics, Phoenix ranked second in spending.
In order to spend extra on healthcare, food and alcohol, Phoenix households spend less on miscellaneous products, cash contributions and housing.
Baltimore
Overall residents in Baltimore tend to spend more on reading, personal insurance and pensions, cash contributions and miscellaneous than other cities. Baltimore ranked fourth or higher in percent of budget spent on each of those categories. In particular, Baltimore residents stand out for the average amount they spend on reading. The average household here spends 0.36% of its budget on reading, which is 250% more than the city which spends the least.
Baltimore residents also stand out for how much they spend on personal insurance and pensions. The average Baltimore household spends over 14.5% of its budget in that category. In comparison, Houston, the city which spends the least on it, spends just over 10%.
Baltimore households are able to put more of their budget toward the previous items because, generally, they spend less on alcohol, tobacco and entertainment. For each of those metrics Baltimore households spend the second-least amount on average.
Atlanta
The average Atlanta household’s budget looks similar to the average Baltimore household’s budget. Both cities tend to dedicate extra spending to personal insurance and pensions and cash contributions. Atlanta residents spend the second-highest and third-highest percent of their budget in those categories, respectively. At the same time, like Baltimore households, Atlanta households tend to spend a relatively small chunk of their budget on alcohol.
One interesting statistic is that Atlanta residents spend a middle-of-the-road amount on transportation. You might expect that given the sprawl and traffic Atlanta is known for, residents would be forced to spend more on vehicles and gas. However Atlanta residents only spend about 16% of their budget on transportation on average, while cities like Dallas and Miami spend 18.1% and 17.5%, respectively.
Dallas-Ft. Worth
Households here, on average, spend more on food, transport and healthcare than other cities. Dallas-Ft. Worth households spent the fourth-largest amount on each of those metrics. Dallas-Ft. Worth residents also spend a relatively large amount on tobacco and entertainment, the city ranked fifth for largest percent of budget spent in both of those categories.
Dallas-Ft. Worth residents spend the fourth-lowest amount on housing, only 32% of their budget on average. Since housing is by far the largest spending category, it means the money saved in that category can be dispersed into a lot of other categories.
Philadelphia
The average Philadelphia household spends about 0.66% of its budget on tobacco products, the most in the study. Philly residents also spend a lot on education. On average residents spend just 0.003% less of their budgets on education than New York (the city which spends the most in this category).
Philadelphia residents tend to make cuts in personal insurance and pensions and personal care. For each of those metrics, Philadelphia ranks in the bottom three for spending.
Data and Methodology
In order to determine what Americans in the biggest cities spend the most on, SmartAsset compared 16 cities across 14 spending categories. Specifically, we looked at the following categories: food, alcohol, housing, transportation, apparel, entertainment, healthcare, reading, education, personal care, tobacco products, miscellaneous, cash contributions and personal insurance and pensions.
We used percent of expenditures spent on each category to compare the cities. We used this metric rather than total dollars spent because this allowed us to control for differences in total spending and differences in median incomes. For example, the average household in Washington, D.C. spends over $81,000 per year and earns $115,258, according to our data. In comparison the average household in Dallas-Ft. Worth spends about $64,000 and earns $76,434. By comparing the average households in each city across percent of budget spent rather than total spent, we’re able to control for these differences.
Data comes from the 2014-2015 Bureau of Labor Statistics Consumer Expenditure Survey.
Tips for Creating Your Own Budget
When creating your budget, you may want to keep in mind is the 50/30/20 rule. According to this budgeting model, you should spend 50% of your after-tax income on necessities like food, housing and transportation. Then 30% of your income can be spend on entertainment. And the remaining 20% should then be put toward financial goals and savings, like retirement.
Of course, everyone is different and it’s important to figure out what works best for you and your lifestyle. As long as you’re making saving for an emergency or the future a priority, you’re likely on the right track.
Questions about our study? Contact us at press@smartasset.com.
Photo credit: ©iStock.com/Dean Mitchell