
Jobs in STEM fields – related to science, technology, engineering and math – are among the fastest-growing and highest-paying jobs in America. But there remains tremendous inequality in the field along racial and gender lines, which can affect where potential employees can choose to relocate.
Some cities are doing better than others when it comes to diversifying their STEM workers. To find where there is the most diversity in STEM workfaces, SmartAsset took a look at the racial and gender breakdown of STEM workers in cities across America. For details on our data sources and how we put the information together to create our final rankings, check out the Data and Methodology section below.
This is SmartAsset’s fourth study on the best cities for diversity in STEM. Read our most recent, the 2017 version, here.
Key Findings
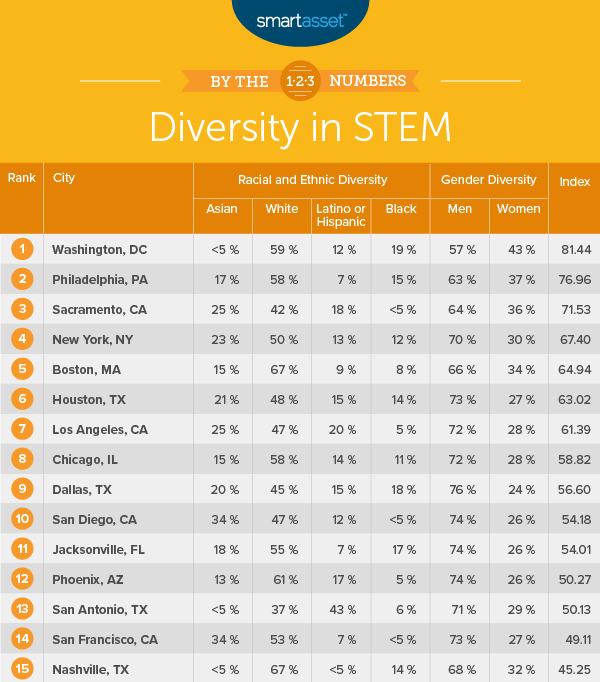
- Gender diversity is still languishing. Even in the top 10 cities, representation of women in STEM does not exceed 45%. The average across all cities in our study is less than 28%. Despite efforts to promote gender inclusivity, and even though STEM jobs are some of the fastest-growing jobs for women in the U.S., it is clear that plenty of work remains to be done.
- Still mostly white. Five cities in our top 10 have STEM workforces that are more than 50% white. Across all 35 cities in our study, white workers represent more than 54% of the STEM workforce. No city in our top 10 – and only one city in our entire study, Atlanta, Georgia – had a STEM workforce that was at least 20% black. The average percentage of Asian workers in STEM across all cities in the study was 17%, and the average percentage of Hispanic or Latino workers was 9%.
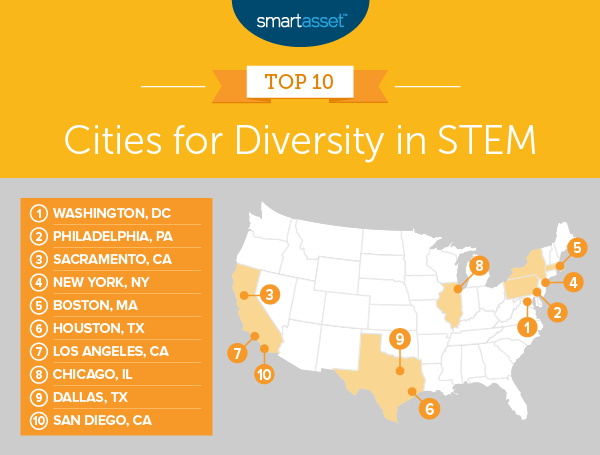
1. Washington, D.C.
Washington, D.C. ranks No. 1 in our study on the best cities for diversity in STEM, jumping from 10th place in our 2017 study. Around 43% of all STEM workers in the nation’s capital are women, the highest percentage in our study. Although it is one of the top cities where seniors are staying in the workforce, D.C. doesn’t do quite as well in terms of racial demographics overall, as 59% of STEM workers are white and fewer than 5% are Asian. The city does have a STEM worker population that is around 19% black, the second-highest percentage of black workers in this study.
2. Philadelphia, PA
Philadelphia, Pennsylvania ranks second in our study. Around 37% of the STEM workers are women in Philadelphia, which is the second-best rate for this metric in the study. Around 58% of the STEM workers in the City of Brotherly Love are white. Black workers make up around 15% of workers in Philly, and Asian workers represent 17%. Hispanic or Latino workers represent approximately 7% of the STEM workforce.
3. Sacramento, CA
Less than 50% of the STEM workers in Sacramento, California are women, though at 36%, it is outpacing 32 of the other cities in our study. Approximately 25% of the STEM workforce in the city is Asian. Only 42% of Sacramento’s STEM workforce is white, making Sacramento one of 15 cities in our study where white workers are not a majority, though they are still a plurality.
4. New York, NY
New York, New York takes the No. 4 spot in our study on the best cities for diversity in STEM. It has a STEM workforce that is 70% men, which although being far from equal, ties for the eighth-lowest rate for this metric across all 35 cities in our study. Approximately 50% of the workforce in New York City is white, while 23% is Asian, 13% is Latino or Hispanic and 12% is black.
5. Boston, MA
Boston, Massachusetts ranks fifth overall. Around 67% of the STEM workforce in Boston is white, the highest percentage for this metric in the top 10 of the study. Only 8% is black, while 9% is Latino or Hispanic and 15% is Asian. Boston fares a bit better for gender diversity. With women constituting 34% of the STEM workers, the city ranks within the top five of our study for this metric. For those who are interested in seeking employment opportunities in Boston, it might also be worth noting that it is one of 2019’s best state capitals to live in.
6. Houston, TX
The STEM workforce in Houston, Texas consists of about 50% nonwhite workers, 21% of whom are Asian, 15% of whom are Latino or Hispanic and 14% of whom are black. In terms of gender diversity, Houston ranks toward the middle of the pack, as less than one-third – or 27% – of STEM workers are women.
7. Los Angeles, CA
Los Angeles, California ranks seventh overall in our study and has a STEM workforce that is 47% white. Around 25% of STEM workers there are Asian, and around 20% are Latino or Hispanic – both top-10 rates. Only around 5% of STEM workers, though, are black. Approximately 28% of the STEM workforce is made up of women, and while this rate is still not equal, it is higher than the percentage for this metric in 19 other cities in our study.
8. Chicago, IL
The STEM workforce in our No. 8 city, Chicago, Illinois, is approximately 58% white, 15% Asian, 14% Hispanic or Latino and 11% black. Like in Los Angeles, women in Chicago constitute 28% of the STEM workforce. For those who want proximity to STEM opportunities without settling in Chicago itself, Aurora, a suburb of Chicago, is the best city for living the American Dream, according to our 2019 study.
9. Dallas, TX
Dallas, Texas – the second of two Texas cities in our top 10 – has a STEM workforce that is approximately 18% black and 45% white. Approximately 20% of the STEM workforce in Dallas is Asian and about 15% is Latino or Hispanic. In terms of gender diversity, women make up less than a quarter of the STEM workforce (24%), the lowest rate for this metric in the top 10 and fourth-lowest in the study.
10. San Diego, CA
Approximately 47% of the STEM workforce in San Diego, California is white, around 34% of workers are Asian, approximately 12% are Latino or Hispanic and fewer than 5% are black. In terms of gender, only 26% of STEM workers are women.
Data and Methodology
SmartAsset analyzed data for the 35 cities in the country with the largest STEM workforces to find the cities with the best diversity. Specifically, we measured across the following metrics:
- Racial diversity index. We calculated this based on the racial diversity of a city among the main Census Bureau groups using the Shannon index. Cities with a more equally distributed workforce across the racial groups received a better score.
- Gender diversity index. This measures the number of women in the workforce compared to men. The city with the highest percentage of women in STEM jobs received a score of 100, and the city with the lowest percentage received a 0.
We averaged these two indexes to create our final score, which we used to rank the cities.
Data for both metrics came from the Census Bureau’s 2017 1-year American Community Survey.
Tips for Managing Your Money
- Invest smarter, with a little help. A financial advisor can help you with a variety of investing issues. SmartAsset’s free tool matches you with financial advisors in your area in 5 minutes. If you’re ready to be matched with local advisors that will help you achieve your financial goals, get started now.
- Understand your paycheck. No matter where you live, you’ll have to pay taxes on each paycheck. See what your actual take home will look like with SmartAsset’s free paycheck calculator.
Questions about our study? Contact press@smartasset.com
Photo credit: ©iStock.com/Lyndon Stratford