
Deciding to leave the home you own might be difficult given the precious memories you’ve made within its walls. But the process of selling it can be downright taxing, especially when the real estate market is unpredictable. Your asking price, mortgage rates and other factors will determine how hard this process will be. Location, however, is arguably one of the most important factors. With that in mind, SmartAsset crunched the numbers and identified the best cities to sell a house.
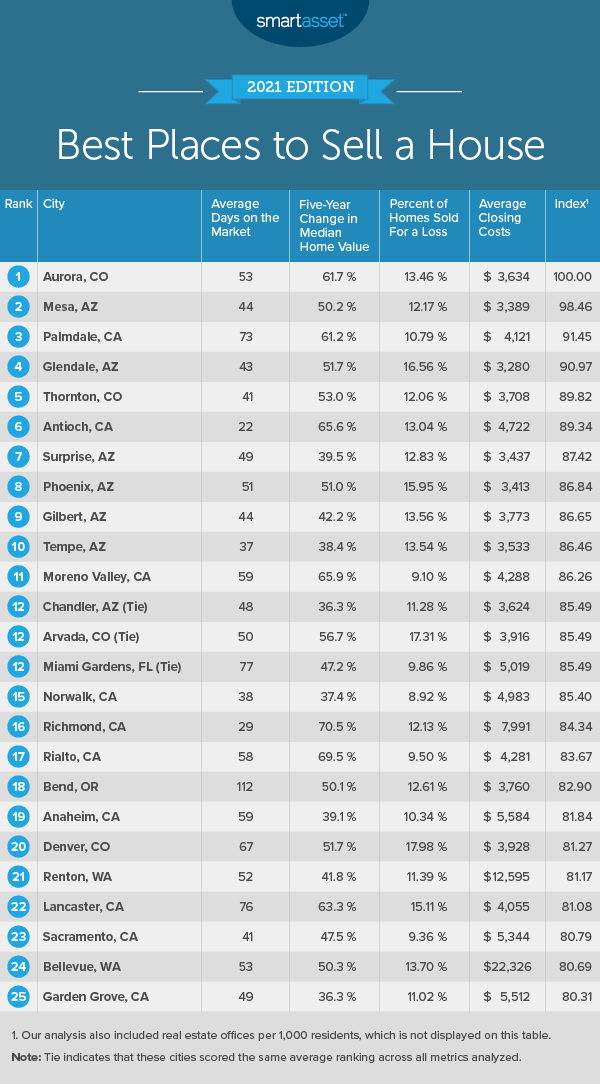
We compared data from 255 U.S. cities and ranked them according to the following metrics: five-year change in median home value, average number of days on the market, percentage of homes sold for a loss, average closing costs and real estate offices per 1,000 residents. For details on our data sources and how we put all the information together to create our final rankings, check out the Data and Methodology below.
This is SmartAsset’s fifth annual study on the best cities to sell a house. Check out the 2020 edition here.
Key Findings
- Western cities are still the best for selling homes. For the fourth consecutive year, all of the cities in our top 10 are located in Western states. This year includes two cities in Colorado, two cities in California and six in Arizona.
- Home values are up. On average, our study shows that home values have risen by 28.7% in the five-year period from 2014 to 2019. The city where home values have gone up the most is Hayward, California, rising 71.1%. The bottom city for this metric is Waterbury, Connecticut, where home values fell 7.1% in the same period.
- Selling takes almost three times longer in the bottom 10. The top 10 cities in our study average 46 days on the market. Wait time for the bottom 10 – located in Illinois, Connecticut, Virginia, Maryland and Pennsylvania – can take almost three times as long, averaging 127 days.
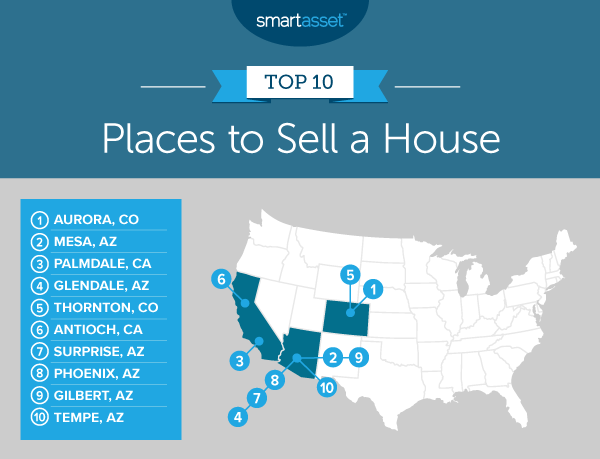
1. Aurora, CO
This suburb of Denver is the best city to sell your house, according to our study. The median home value in Aurora has increased 61.7% in the five-year period from 2014 to 2019, the 14th-highest jump for this metric in our study. Aurora homes average 53 days on the market, ranking 46th for this metric. Furthermore, Aurora holds the 24th-highest ranking for the number of real estate offices per resident – 1.92 for every 1,000 people.
2. Mesa, AZ
Mesa, Arizona is the first of six Arizona cities in the top 10 of this list. Houses in this Phoenix suburb average 44 days on the market, ranking 22nd-best for this metric. The median home value has gone up 50.2% in the five-year period from 2014 to 2019, finishing 37th for this metric overall. Additionally, just 12.17% of homes in this city were sold at a loss, ranking 54th-best for this metric across all 255 cities in the study.
3. Palmdale, CA
The median home value in Palmdale, California has gone up by 61.2% from 2014 to 2019, the 15th-biggest five-year jump in the study. This suburb of Los Angeles has 1.53 real estate offices for every 1,000 residents, ranking 55th out of 255 for this metric. Palmdale is also in the top quartile of the study for its relatively low percentage of homes sold at a loss, at 10.79% and ranking 30th. However, it ranks in the middle of this study for closing costs, averaging $4,121.
4. Glendale, AZ
The average home in Glendale, Arizona is on the market for 43 days, which is the 17th-fastest turnaround in our study. This city is another suburb of Phoenix, and has risen 51.7% in median home value over the five-year period from 2014 to 2019, ranking 24th out of 255 for this metric. Closing costs for Glendale homes are $3,280, the 50th-lowest in our study.
5. Thornton, CO
Coming in as the No. 5 city in the U.S. to sell your home, Thornton, Colorado is the second suburb of Denver (along with Aurora) that ranks in our top 10. The average time a Thornton home stays on the market is just 41 days, the 12th-shortest selling time in our study. The median home value in this city has also risen 53.0% in the five-year period from 2014 to 2019, ranking 22nd-best for this metric. What’s more, just 12.06% of the homes were sold at a loss, making Thornton 49th-best for this metric overall.
6. Antioch, CA
Located in the East Bay of San Francisco, Antioch is the second California city in our top 10. The median home value rose 65.6% from 2014 to 2019, ranking ninth-highest in the study for this five-year change. Homes there take an average of 22 days to sell on the market, the third-shortest selling time in the study. Closing costs, however, are relatively expensive – averaging $4,722, which ranks 156th out of 255.
7. Surprise, AZ
Surprise, Arizona is the third suburb of Phoenix in the top 10. The average home takes 49 days to sell on the market, ranking 35th for that metric in our study. The median home value in this city has risen 39.5% in the five-year period from 2014 to 2019, with less than 13% of homes sold at a loss. Surprise has 1.46 real estate offices for every 1,000 residents, which, being a county-level metric, ties for 73rd out of 255.
8. Phoenix, AZ
Phoenix, Arizona has seen a 51.0% increase in median home value in the five years from 2014 to 2019, ranking 32nd for that metric in the study. Phoenix ranks 39th-lowest out of 255 for the average number of days a home takes to sell on the market – less than two months (51 days). That said, 15.95% of homes are sold at a loss, which places Phoenix in the bottom half of the study for that metric.
9. Gilbert, AZ
Gilbert, Arizona is the fourth suburb of Phoenix in our top 10. This city’s population has boomed from almost 30,000 in 1990 to more than 255,000 in 2019, making it one of the 10 largest municipalities in Arizona. Gilbert homes have the 19th-shortest selling time on our list, averaging 44 days on the market. Gilbert’s median home value has grown 42.2% over the five-year period from 2014 to 2019, ranking 65th overall for that metric. Closing costs in this city average $3,773.
10. Tempe, AZ
Located in the East Valley of metropolitan Phoenix, Tempe rounds out the top 10 in our study on the best cities to sell a house. Homes in this Arizona city average 37 days on the market, the seventh-shortest selling time on our list. The median home value has risen 38.4% in five years, from 2014 to 2019. Less than 14% of Tempe homes were sold at a loss – 13.54% to be exact, ranking 87th out of 255 for that metric.
Data and Methodology
To find the best cities to sell a house, SmartAsset considered available data for 255 of the largest U.S. cities across the following metrics:
- Five-year change in median home value. This is the percentage change in median home values from 2014 through 2019. Data comes from the Census Bureau’s 2014 and 2019 5-year American Community Surveys.
- Average number of days on the market. This is the average number of days a home is on the market before it is sold. Data comes from SmartAsset’s December 2020 study on the healthiest housing markets.
- Percentage of homes sold for a loss. This is the percentage of homes sold for a price lower than the previous sale price. Data comes from SmartAsset’s December 2020 study on the healthiest housing markets.
- Closing costs. This represents average closing costs by city. Data comes from SmartAsset’s December 2020 study on places with the lowest closing costs.
- Real estate offices per 1,000 residents. This is the number of real estate offices per 1,000 residents. Data comes from the Census Bureau’s 2018 County Business Patterns Survey.
To create the final scores, we ranked all of the cities in each metric. Next, we found each city’s average ranking, giving a single weight to all measures except for the one measuring change in home value, which received a double weight. Using this average ranking, we created our final score. The city with the best average ranking received a score of 100 and the city with the worst average ranking received a 0.
Tips for Selling Your Home
- Don’t sell yourself short. Invest in expert guidance. If you’re looking to sell (or buy) a house, a financial advisor could help you create a plan to set and reach financial goals for your home. SmartAsset’s free tool matches you with financial advisors in your area in five minutes. If you’re ready to be matched with local advisors that will help you achieve your financial goals, get started now.
- Take note of all possible costs. If you want to figure out the cost of buying a new home, SmartAsset’s closing costs calculator will help you estimate how much you could end up paying.
- Relocating? Forecast your new paycheck taxes. If you’re moving to work in one of the cities from our study, SmartAsset’s paycheck calculator will help break down your new take home based on local taxes.
Questions about our study? Contact press@smartasset.com.
Photo credit: ©iStock.com/Feverpitched