
People working in the same profession can have vastly different incomes, often related to where they live. After all the cost of living in a place can have a significant impact on pay. Waiters and waitresses, for example, may be paid more in New York, New York than they are in Minneapolis, Minnesota simply because many expenses such as food, transportation and housing are higher in the Big Apple than they are in the Mini-Apple. Additionally, workers’ earnings are subject to supply and demand curves in each place, and as a result, the prevalence of certain industries in a place may skew earnings up or down.
In this study, we looked at which occupations with more than 100,000 workers nationally have the greatest range of salaries across all 50 U.S. states as well as the District of Columbia. Using Bureau of Labor Statistics (BLS) data from 2018, we compared the national average annual salary for each occupation to the maximum and minimum salaries for each occupation by state. For more information on our data sources and how we put together our findings, check out our Data and Methodology section below.
Key Findings
- Location seems to matter the most for low-paying jobs. The average national annual salary for five of our top 10 jobs – that is, the jobs with the largest salary range – is less than $50,000. Of those, four are in our top five. They include bartenders, printing press operators, waiters and waitresses and substitute teachers. By contrast, four of the occupations with the lowest variation in pay across states have average annual salaries greater than $100,000. They include pharmacists, nurse practitioners, industrial production managers and electrical engineers.
- Pay skews more upward than downward. Compared to the average pay for the top 10 occupations nationwide, we found that workers in the state with the highest pay earn 83% more, on average, while workers in the state with the lowest pay earn an average of 36% less.
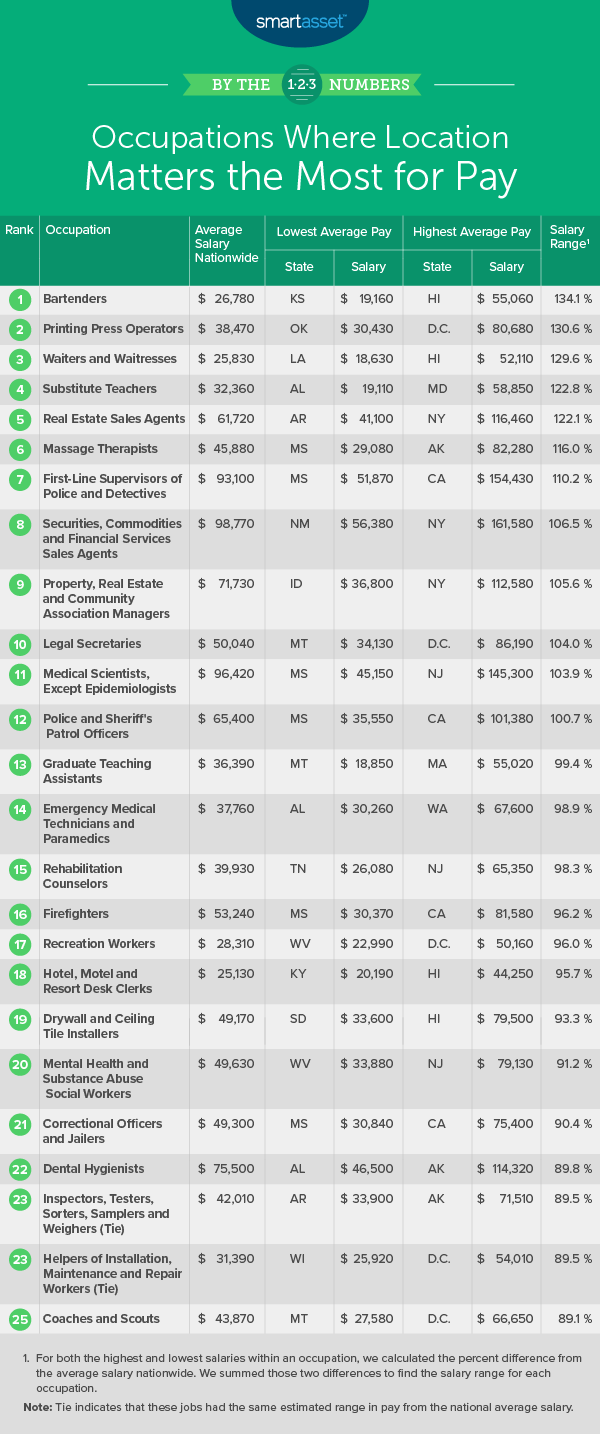
1. Bartenders
According to the Bureau of Labor Statistics, in 2018, bartenders in the U.S. made $26,780 annually on average. However, average wages for bartenders varied significantly by state. In Hawaii, the average annual income for a bartender was $55,060, 105.6% more than the national average, while in Kansas, bartenders made $19,160 on average, 28.5% less than they did nationally. Summed, the range above and below the national average in 2018 was 134.1%, the largest of any occupation in the U.S. with more than 100,000 workers.
2. Printing Press Operators
In 2018, there were 173,470 printing press operators in the U.S. With an average national salary of $38,470, printing press operators were paid the most in the District of Columbia and the least in Oklahoma, making $80,680 and $30,430 in the two places, respectively. Workers in this field would benefit from noting, however, that Oklahoma is one of the top five cheapest states to buy a home, and the nation’s capital is ranks among the five most expensive places nationwide.
3. Waiters and Waitresses
Like bartenders, waiters and waitresses are generally paid the most in Hawaii of any state. In fact, the location quotient – the ratio of an occupation’s share of employment in a given area to that occupation’s share of employment in the U.S. as a whole – is the highest for waiters and waitresses in Hawaii compared to any other state for this occupation, at 1.67 in 2018.
Waiters and waitresses have the lowest annual salaries on average in Louisiana. Interestingly, the location quotient in Louisiana is 1.14, the 10th-highest of any state for this occupation, yet the gross number of waiters and waitresses in Louisiana far exceeds that of Hawaii. In 2018, there were 38,950 total waiters and waitresses in Louisiana and only 19,130 in Hawaii.
4. Substitute Teachers
The top three occupations on our list – bartenders, printing press operators and waiters and waitresses – all are occupations where the upward range for salary more than doubles the downward range. The ranges for substitute teachers, which takes the No. 4 spot, just miss this mark by 0.1%. In Maryland, the average annual income for substitute teachers was $58,850 in 2018, 81.9% more than the national average, while in Alabama, substitute teachers made $19,110 on average, 41.0% less than they did nationally.
5. Real Estate Sales Agents
Likely driven by the intense New York City real estate market, real estate sales agents had the highest average annual salaries in New York in 2018, making almost $55,000 more than the national average for this occupation. Specifically, in 2018, real estate sales agents made $116,460 in New York on average, while the national average was only $61,720.
In stark contrast to New York, Arkansas had the lowest average pay for real estate sales agents of any state in 2018, making only $41,100.
6. Massage Therapists
There were 105,160 massage therapists in the U.S. in 2018, the lowest number of total workers for any occupation in our top 10. Of those, 540 work in Alaska and 320 work in Mississippi, where pay is the highest and lowest, respectively. In 2018, the average annual salary for a massage therapist in Alaska was $82,280 and in Mississippi it was $29,080. In terms of deviation from the national average of $45,880, massage therapists in Alaska made about 79.3% more while massage therapists in Mississippi made about 36.6% less.
7. First-Line Supervisors of Police and Detectives
The range in average incomes across states for first-line supervisors of police and detectives spans more than $100,000, the second-highest of any occupation in our top 10. In California, first-line supervisors of police and detectives made $154,430 in 2018, and in Mississippi, they made only $51,870. With respect to the national average salary of $93,100 for this occupation, first-line supervisors of police and detectives make 65.9% more in California than they do nationally and 44.3% less in Mississippi.
8. Securities, Commodities and Financial Services Sales Agents
The national average salary for securities, commodities and financial services sales agents is the highest of any occupation in our top 10. In 2018, securities, commodities and financial services sales agents made $98,770 on average in the U.S. On a state-by-state basis, securities, commodities and financial services sales agents generally make the most in New York and the least in New Mexico.
9. Property, Real Estate and Community Association Managers
Property, real estate and community association managers plan and coordinate the selling, buying or leasing of different types of real estate properties. The types of real estate properties range from commercial to industrial to residential. In 2018, there were 202,550 property, real estate and community association managers in the U.S. who made $71,730 annually on average. In terms of state variance according to pay, property, real estate and community association managers made the most in New York and the least in Idaho. Specifically, the average annual salary for property, real estate and community association managers was $112,580 in New York and $36,800 in Idaho in 2018.
10. Legal Secretaries
Legal secretaries have the highest average salaries in the District of Columbia and the lowest in Montana. Specifically, in 2018, the average annual salary for a legal secretary in the District of Columbia was $86,190, while it was only $34,130 in Montana. In terms of range, salaries for legal secretaries in the District of Columbia are 72.2% greater than the national average for this occupation and 31.8% lower than the national average in Montana. D.C. also ranks among the best places to be a lawyer.
Data and Methodology
To find the occupations where location matters the most for pay, SmartAsset looked at employment data from 2018 on both the national and state level for all 50 states as well as the District of Columbia. Considering only occupations with more than 100,000 workers nationally and filtering out occupations with “other” or “miscellaneous” in the title due to lack of specificity, we compared the maximum and minimum average state salaries for each occupation to the national salary for that occupation. Specifically, for both the highest and lowest salaries within an occupation, we calculated the percentage difference from the average salary nationwide. We summed those two differences to find the salary range for each occupation. We then sorted occupations according to this range, with occupations with the largest ranges ranking the highest.
All data comes from the Bureau of Labor Statistics and is for 2018.
Tips for Saving for Retirement
- Smarter savings. As you grow your career, it’s important to grow your savings as well in order to make sure you have enough set aside for your future. Take advantage of your employer’s 401(k) match if available and use a comprehensive retirement calculator to get a sense of what your situation might look like.
- Get financial help. Finding the right financial advisor that fits your needs doesn’t have to be hard. SmartAsset’s free tool matches you with financial advisors in your area in 5 minutes. If you’re ready to be matched with local advisors that will help you achieve your financial goals, get started now.
Questions about our study? Contact us at press@smartasset.com
Photo credit: ©iStock.com/Zbynek Pospisil