
Safety is often at the top of most people’s list when they’re picking a place to live. Choosing the right city allows them the peace of mind to work and raise a family. Given those considerations, SmartAsset decided to find the safest cities in America.
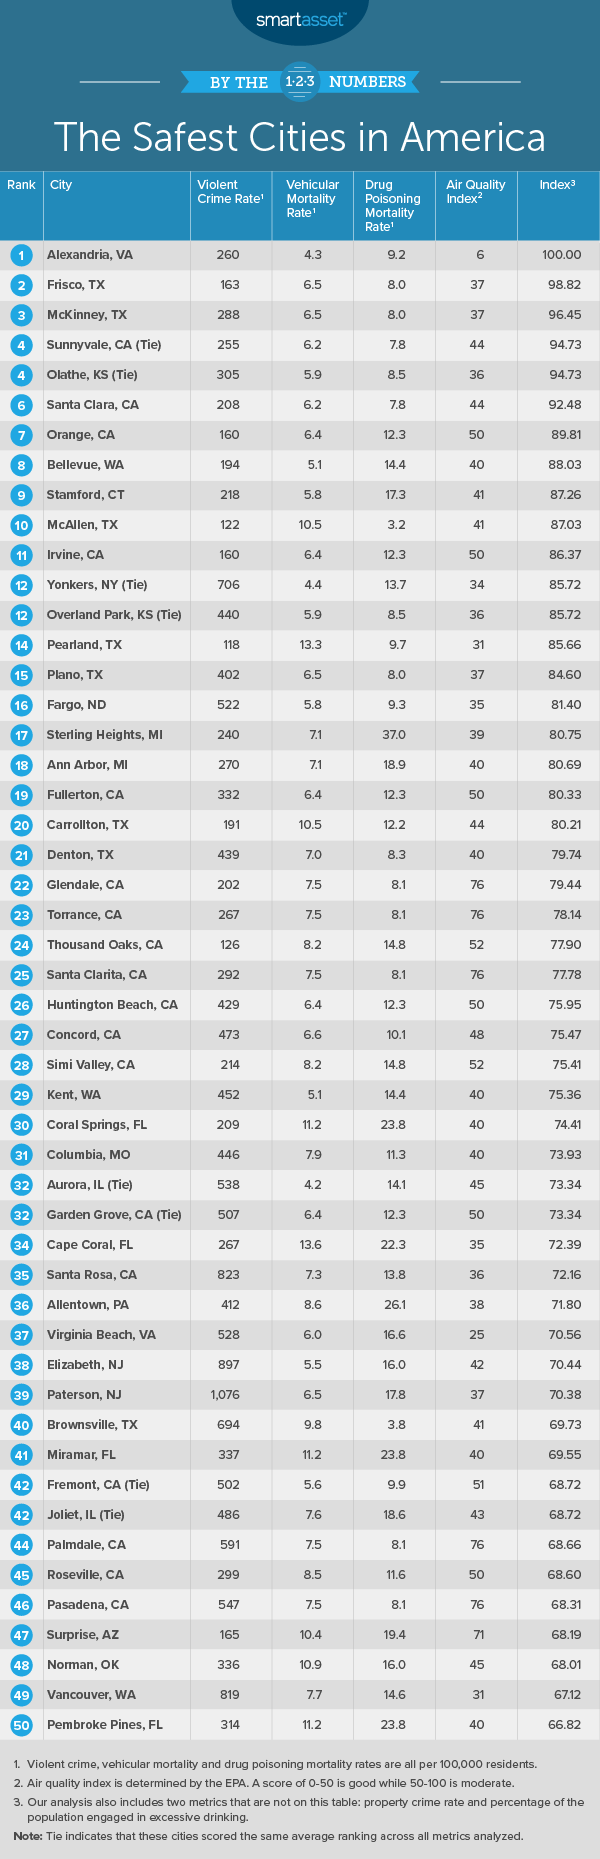
In order to uncover the safest cities in the U.S., SmartAsset looked at the following metrics: violent crime rate, property crime rate, vehicular mortality rate, drug poisoning mortality rate, percentage of population engaging in excessive drinking and air quality index. For more details on how we found and analyzed our data, see the data and methodology section below.
Key Findings
- Texas and California take the top 10. Three of the top 10 cities in our study are in Texas – Frisco, McKinney and McAllen – and three others are in California – Sunnyvale, Santa Clara and Orange. They all perform particularly well in having low violent crime rates and drug poisoning rates.
- Suburban cities rank on top. It isn’t big cities or rural locations that lead this list, but suburbs that can offer more potential for safety. Cities like Los Angeles, Las Vegas, Chicago and Houston rank in the bottom 25 of the study.
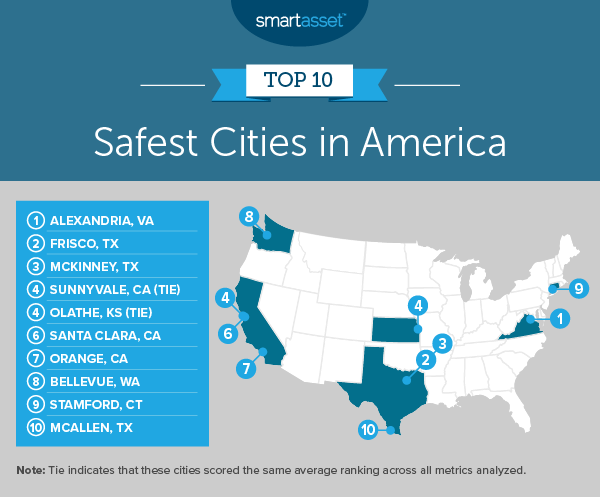
1. Alexandria, VA
Alexandria, Virginia, a suburb of Washington, D.C., ranks first in our study on the safest cities in the U.S. It has the best air quality index, with a score of six, out of all 200 cities for which we considered data. Alexandria also has the seventh-lowest vehicular mortality rate in the study, at 4.34 per 100,000 residents. The city has top-20 scores for both violent crime rate, at 260 per 100,000 residents, and property crime rate, at 2,482 per 100,000 residents. Alexandria also ranks in the top 10 in our study of where women are the most successful.
2. Frisco, TX
Frisco, Texas, part of the Dallas-Fort Worth area, ranks in the top 25 for three of the metrics we considered. It has the sixth-lowest violent crime rate overall at 163 per 100,000 residents. It is tied for the 14th-lowest total number of drug poisoning deaths overall, at approximately eight per 100,000 residents. Frisco also has the 22nd-lowest property crime rate, at 2,562 per 100,000 residents.
3. McKinney, TX
McKinney, Texas, another city in the greater Dallas-Fort Worth metroplex, has the eighth-lowest property crime rate in this study, at 1,980 per 100,000 residents. McKinney ranks in the top 25 for violent crime at 288 per 100,000 residents and top 15 for drug poisoning mortality at 8.04 per 100,000 residents. McKinney also ranks high in our study of the best places to raise a family in Texas.
4. Sunnyvale, CA (tie)
Sunnyvale, California, which ties for fourth place with Olathe, Kansas, is a Bay Area city that has the 10th-lowest drug poisoning mortality rate in the study, at 7.76 per 100,000 residents. The percentage of the population engaging in excessive drinking is tied for the 14th-lowest in the study, 15.92%. Both crime rates are relatively low and land in the top 25 of this study — 255 violent crimes and 2,541 property crimes per 100,000 residents.
4. Olathe, KS (tie)
Olathe, Kansas ties for fourth place in the study with Sunnyvale, California, and has the seventh-lowest property crime rate in this study at 1,957 incidents per 100,000 residents. It has the 24th-best air quality score across all 200 cities in the study. The vehicular mortality rate is 5.89 incidents per 100,000 residents, tied for the 27th-lowest in the study. Olathe also has the 27th-lowest violent crime, at 305 per 100,000 residents.
6. Santa Clara, CA
Santa Clara, California, another town in the Bay Area, has the 10th-lowest drug poisoning mortality rate – at 7.76 incidents per 100,000 residents – and 11th-lowest violent crime rate – 208 incidents per 100,000 residents. The property crime rate in Santa Clara is 3,741 per 100,000 residents, which ranks 52nd, just within the top third of the study.
7. Orange, CA
Orange ranks seventh overall and is the third California city to make the top 10. It has the fourth-lowest violent crime rate of the 200 cities we studied, at 160 incidents per 100,000 residents. Orange also has the 19th-lowest property crime rate, at 2,478 per 100,000 residents. The city’s vehicular mortality rate of 6.41 deaths per 100,000 residents and its 16.98% of the population engaging in excessive drinking are also relatively low, both ranking within the top 35 out of all 200 cities. But California overall ranks as one of the states with the worst drivers.
8. Bellevue, WA
Bellevue, Washington has the ninth-lowest violent crime rate in the study, at 194 incidents per 100,000 residents, and the ninth-lowest vehicular mortality rate in the study, at 5.07 deaths per 100,000 residents. Bellevue also has an air quality index of 40 and ranks 56th best for this metric.
9. Stamford, CT
Stamford, Connecticut has the 14th-lowest rate of violent crime in the study, at 218 incidents per 100,000 residents. Stamford also stands out for its relatively low property crime rate. At 2,120 incidents per 100,000 residents, it ranks 11th-lowest overall for this metric. The vehicular mortality rate in Stamford is also low, at 5.78 incidents per 100,000 residents, a top-25 rate.
10. McAllen, TX
McAllen, Texas rounds out our top 10. It has the lowest drug poisoning mortality rate in this study, approximately three deaths per 100,000 residents. It also has the fifth-lowest percentage of residents engaging in excessive drinking, at 14.46%. The violent crime rate is 122 per 100,000 residents, the second-lowest rate for this metric in the study. McAllen ranks as one the top cities where a $1 million retirement fund would go the furthest.
Data and Methodology
To find the safest cities in America, SmartAsset compared 200 cities across the following metrics:
- Violent crime rate. The number of violent crimes per 100,000 residents. Data comes from the FBI’s 2018 Uniform Crime Reporting Database.
- Property crime rate. The number of property crimes per 100,000 residents. Data comes from the FBI’s 2018 Uniform Crime Reporting Database.
- Vehicular mortality rate. The number of deaths due to traffic accidents per 100,000 residents. Data comes from countyhealthrankings.org and is for 2019.
- Drug poisoning mortality rate. The number of drug poisoning deaths per 100,000 residents. Data comes from countyhealthrankings.org and for 2019.
- Percentage of the population engaging in excessive drinking. The percentage of adults who consumed more than four drinks of alcohol for women or five drinks of alcohol for men on a single occasion over a 30-day period, or who engage in heavy drinking, which is defined as drinking more than one drink per day for women or two drinks a day for men on average. Data comes from countyhealthrankings.org and is for 2019.
- Air quality index. A measure of the air pollution in each city. The Air Quality Index data comes from the Environmental Protection Agency. A lower score is better. Data come from the Environmental Protection Agency and is for 2018.
First, we ranked each city in each metric. We then calculated the average ranking of each city, with all metrics receiving an equal weight except for two: violent crime rate, which received a double weight, and drug poisoning mortality rate and percentage of the population engaging in excessive drinking, each of which received a half weight. Using this average ranking, we created our final score. The city with the best average ranking received a 100. The city with the worst average ranking received a 0.
Getting the Most from Your Money
- Don’t risk your financial safety by going it alone. A financial advisor can help you make your dream of living in a safe town a financial reality. SmartAsset’s free tool matches you with financial advisors in your area in 5 minutes. If you’re ready to be matched with local advisors that will help you achieve your financial goals, get started now.
- How much house can you afford? You’ll want to make sure you house you buy in your dream town fits in your budget. Check it out using SmartAsset’s calculator to see how much house you can afford.
Questions about our study? Contact press@smartasset.com
Photo credit: ©iStock.com/SDI Productions