
Lack of investment in infrastructure within a state can have tangible effects on its residents’ finances. The American Society of Civil Engineers’ 2016 report “Failure to Act” quantifies these effects, stating that on a national level, American families lose $3,400 in disposable income every year – $9 a day – due to infrastructure deficiencies, which could be money they could otherwise be using toward paying off their mortgages faster. In addition to increasing housing and utilities costs as well as the cost of personal transportation, deteriorating infrastructure increases costs incurred by businesses in terms of services and efficiency, which ultimately leads to higher prices for individuals.
Some states have stepped in to address infrastructure shortfalls themselves. For instance, the report notes that 23 states increased state gas tax rates between 2010 and 2016 to fund infrastructure investments. In this study, SmartAsset examined the states in the U.S. with the best infrastructure, as the benefits of stronger state infrastructure may be particularly important for potential homebuyers.
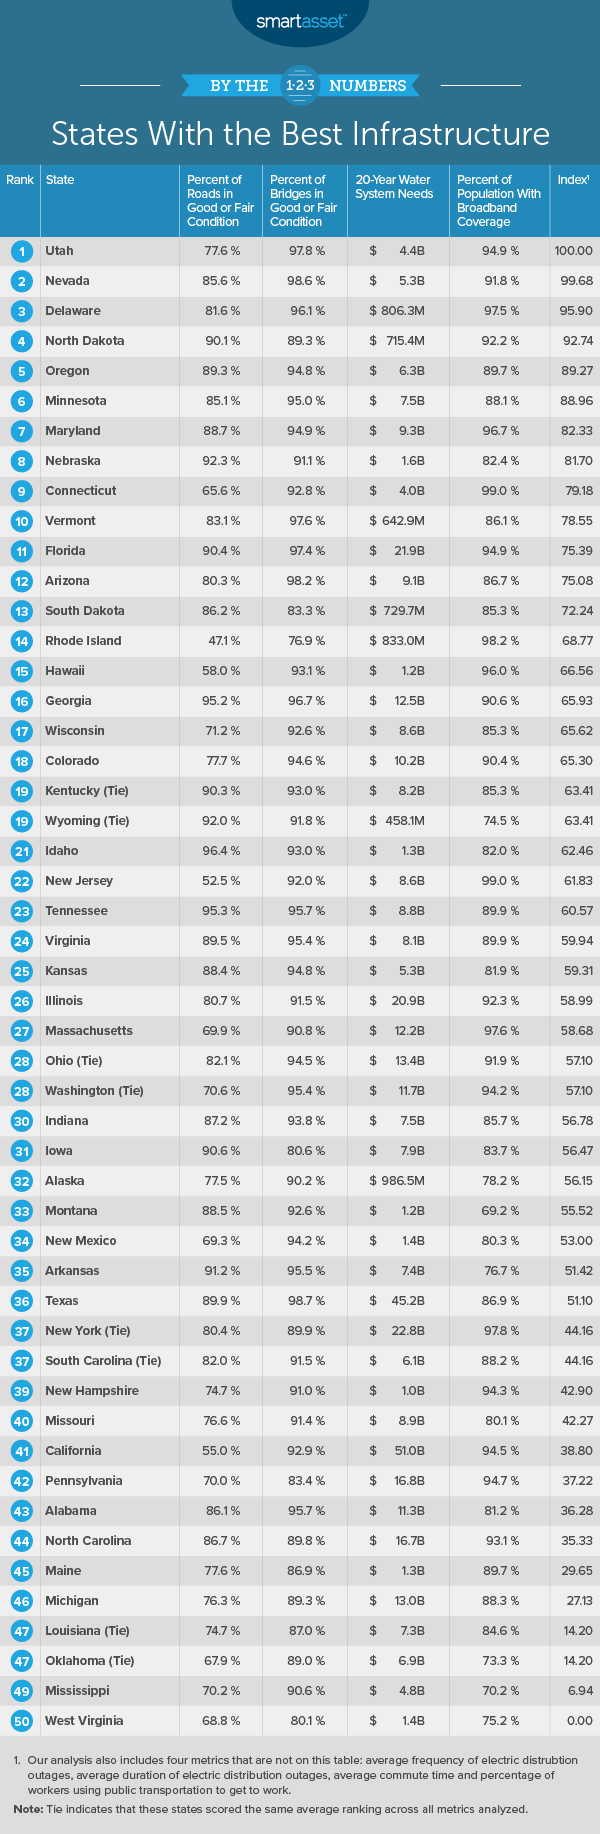
To find the states with the best infrastructure, we compared states across eight metrics related to road, bridge and public transportation quality; internet coverage; water system needs and electric grid reliability. For details on our data sources and how we put all the information together to create our final rankings, check out the Data and Methodology section below.
Key Findings
- Our top 10 is spread out nationwide. States with the best infrastructure are not focused in any particular region. Based on Census regional divisions, our top 10 includes three states in the West, two in the Northeast, three in the Midwest and two in the South.
- Southern states populate the bottom 10. Six of the 10 states ranking 41st through 50th are located in the South. They include Alabama, North Carolina, Louisiana, Oklahoma, Mississippi and West Virginia.
- There’s a large disparity in water system needs. Projected 20-year water system fiscal needs span from hundreds of millions in some states to tens of billions of dollars. in others Specifically, the Environmental Protection Agency predicts that Wyoming will require the least amount of investment in its water system over the next 20 years, only $458.1 million, while California will require the most, $51.0 billion.
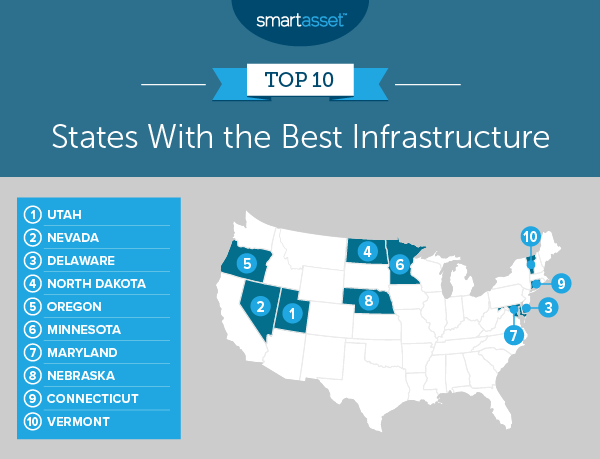
1. Utah
Utah takes the leading spot on our list. Potential homeowners in Utah may find it a great place to enjoy the benefits of a strong state infrastructure. Residents there generally have shorter commute times and better broadband coverage than residents in most other states, ranking 12th and ninth in the two metrics, respectively. The average commute time for workers in 2017 was 22.0 minutes, according to Census findings, and 94.9% of the population had broadband coverage in 2018, according to data from BroadbandNow.
2. Nevada
Nevada comes in at No. 2 and ranks in the top half of states for all eight metrics that we considered. Roughly 3.1% of workers in Nevada use public transportation to get to their jobs, the 15th-highest percentage of any state. The Department of Transportation reports that 85.6% of roads and 98.6% of bridges are in good or fair condition, the 21st– and second-highest rates of any state, respectively. Furthermore, Nevada is one of the top 10 states leading the charge on renewable energy.
3. Delaware
According to the Environmental Protection Agency, Delaware will require an estimated $806.3 million in water infrastructure investments over the next 20 years. Relative to other states, this is a relatively low figure, the fifth-lowest overall. By comparison, California, the state with the highest estimate, will need more than $51 billion invested in its water system over the next 20 years.
To help manage household costs associated with water and electric bills while staying on track to secure or pay off a mortgage, residents may be interested in seeking the guidance of one of the top financial advisor firms in Delaware.
4. North Dakota
Residents in North Dakota have the shortest average commute time of residents in any state. According to Census data, in 2017, the average commute time for workers was less than 17 minutes. While it is possible that workers may live closer to their places of work in North Dakota, shorter commutes may also be a product of generally favorable road conditions. The Department of Transportation reports that 90.1% of roads in North Dakota are in good or fair condition, the 10th-highest of any state. North Dakota is also one of the top 10 states where it costs the least to be rich.
5. Oregon
Like Nevada, Oregon ranks in the top half of all states for all eight metrics that we considered. Specifically, Portland is one of the top 10 places where it pays off to negotiate on home price, so current or potential residents will likely get more bang for their buck on housing while also reaping the benefits of its state’s strong infrastructure. Oregon’s best-performing metrics are percentage of workers using public transport to get to work, percentages of roads and bridges in good or fair condition and average frequency of electric distribution outages lasting longer than five minutes. Specifically, 4.5% of workers regularly use public transportation, 89.3% and 94.8% of roads and bridges respectively are in good or fair condition and electricity customers in the state experienced an average of 0.85 outages in 2017. All of these are top-20 rates.
6. Minnesota
The Energy Information Administration (EIA) reports on electric power industry reliability in each state on an annual basis. According to the most recent EIA data, Minnesota’s electric power reliability ranks well relative to that of other states. Excluding major events, there were an average of 0.75 power outage occurrences lasting longer than five minutes in 2017, the sixth-lowest frequency of any state. Furthermore, outages lasted an average of 70.49 minutes, the fifth-shortest duration of any state.
In addition to its robust electricity infrastructure, Minnesota’s road system is strong as well. About 85.1% of roads and 95.0% of bridges in Minnesota are in good or fair condition. Additionally, a relatively large percentage of residents take advantage of the public transportation system. According to Census estimates, 3.7% of residents use public transportation to get to work, the 13th-highest percentage of workers for this metric in any state and the fourth-highest of any state in our top 10.
7. Maryland
About 8.5% of residents in Maryland rely on public transportation to get to work, the fifth-highest rate for this metric of any state and the highest by far of any state in our top 10. Incidentally, Baltimore, Maryland is one of the top 10 places where people spend the most on transportation. Additionally, roads and bridges in Maryland are in generally good condition. The Department of Transportation reports that in 2017, 88.7% of roads and 94.9% of bridges in Maryland were in good or fair condition, the 14th– and 15th-highest percentages of any state, respectively.
8. Nebraska
According to 2019 data from the Department of Transportation, 92.3% of roads in Nebraska are in good or fair condition, the fourth-highest percentage of any state in our study and the highest of any state in the top 10. The quality of roads may be especially important for Nebraskans, as only 0.7% of workers use public transportation to get to work.
In addition to generally high road quality, Nebraska has a strong electricity infrastructure. In 2017, excluding major events, there were an average of 0.68 power outage occurrences lasting longer than five minutes, the fourth-lowest frequency overall. Additionally, for those instances, the average electricity customer in Nebraska was without power for less than 73 minutes, the 10th-lowest duration across all 50 states in the study.
9. Connecticut
Connecticut, ranking ninth overall, ties with New Jersey for the highest broadband coverage in the study, at 99% of its population. Additionally, though roads in Connecticut need a fair amount of work, most bridges are in good condition. In 2017, only 65.6% of roads, but 92.8% of bridges, were in good or fair condition.
10. Vermont
Electric distribution outages are fairly common for residents in Vermont. In 2017, excluding major events, there were an average of 1.63 power outage occurrences lasting longer than five minutes, the fifth-highest rate of any state in the study. In addition, the average duration of electric distribution outages in the state was more than 180 minutes, the seventh-highest duration in the study overall. Despite this, Vermont performs well across the remaining metrics. About 83.1% of roads and 97.6% of bridges in Vermont were in good or fair condition in 2017, ranking 23rd– and fifth-best in those metrics, respectively. Furthermore, water systems needs are relatively low in Vermont compared to in other states. The EPA estimates that $642.9 million will be needed in investment over the next 20 years, the second-lowest figure for this metric in the study.
Data and Methodology
To find the states with the best infrastructure, SmartAsset looked at data for all 50 states. We compared the states across the following eight metrics:
- Percentage of roads in good or fair condition. Data comes from the Department of Transportation and is for 2017.
- Percentage of bridges in good or fair condition. Data comes from the Department of Transportation and is for 2017.
- 20-year water system needs. This is an estimate of each state’s 20-year water system fiscal needs. Data comes from the Environmental Protection Agency’s 2018 report “Drinking Water Infrastructure Needs Survey and Assessment.”
- Broadband coverage. This is the percentage of the population with broadband coverage. Data comes from BroadbandNow and is for 2018.
- Average frequency of electric distribution outages. This is the average number of power outage occurrences lasting longer than five minutes and excluding major events in a year. Data comes from the Energy Information Administration and is for 2017.
- Average duration of electric distribution outages. This is the average duration in minutes of power outages for occurrences lasting longer than five minutes and excluding major events. Data comes from the Energy Information Administration and is for 2017.
- Average commute time. This is the average amount of time in minutes that residents travel to and from work. Data comes from the U.S. Census Bureau’s 2017 1-year American Community Survey.
- Percentage of workers using public transportation to get to work. Data comes from the U.S. Census Bureau’s 2017 1-year American Community Survey.
To create our final score, we ranked each state in each metric. Then we found each state’s average ranking, giving equal weighting to all metrics with the exception of average frequency of electric distribution outages and average duration of electric distribution outages, both of which were half-weighted. We used this average ranking to create our final score. The state with the best average ranking received a score of 100. The state with the worst average ranking received a score of 0.
Tips for Finding a Home
- Make sure you can handle a mortgage. If you’re thinking about settling into a new or perhaps even a bigger home, recognize that a mortgage is a big commitment. Be certain you’ll be able to afford whatever you’ll end up having to pay. Use SmartAsset’s mortgage calculator to see the ideal range in which you should be shopping.
- Trusted personal finance advice. A financial advisor can help you make smarter financial decisions such as moving or being in better control of your money as you navigate finding a new job or helping a loved one pay for educational costs. Finding the right financial advisor that fits your needs doesn’t have to be hard. SmartAsset’s free tool matches you with financial advisors in your area in 5 minutes. If you’re ready to be matched with local advisors that will help you achieve your financial goals, get started now.
Questions about our study? Contact us at press@smartasset.com
Photo credit: ©iStock.com/metamorworks