
Families move for a wide variety of reasons. In one U.S. Census Bureau survey of Americans who had recently relocated, roughly half of all respondents cited housing as the primary reason for their move, while 30% said they moved for family reasons and 20% moved for work-related reasons.
This is the 2015 version of SmartAsset’s study. Read the 2016 version here.
For parents, whether they are changing homes specifically to find a better environment for their children or for some other reason (like finding more affordable housing), their kids’ best interests are usually a high priority. Safety, schools and health are primary considerations. Likewise, the cost of raising a child in that location can be an important factor.
To find the best cities for children, SmartAsset looked at data on 13 different metrics across the 200 largest cities in the U.S. We wanted to find cities that provided good environments for children in many ways.
The quality of local schools was a key factor in our analysis. We considered graduation rates and student proficiency in math, reading and writing. We also looked at air quality and water quality measures, infant and child mortality rates, the percentage of children with health insurance and intergenerational mobility. (Read more about our methodology below.)
Key Findings of the Best Cities for Children
-Happy campers in the Upper Midwest. Five Midwestern states – Iowa, the Dakotas, Wisconsin and Nebraska – are home to seven of the top ten cities for children. These areas all have good schools and relatively high rates of economic mobility.
– Connecticut too. Two metros in the Nutmeg State rank among the best cities for children: Norwich and Bridgeport. These areas rate very well for safety and environmental quality.
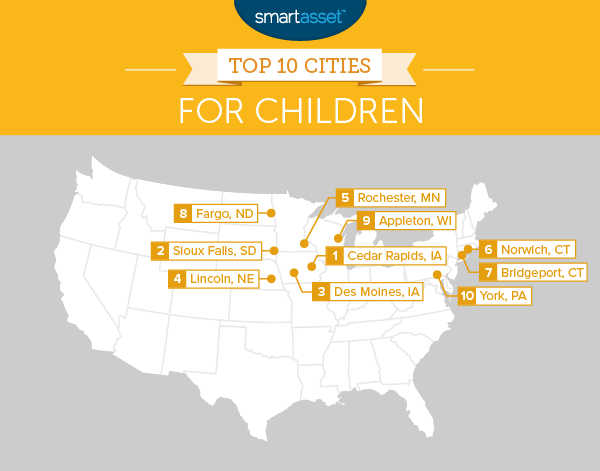
Cedar Rapids, Iowa
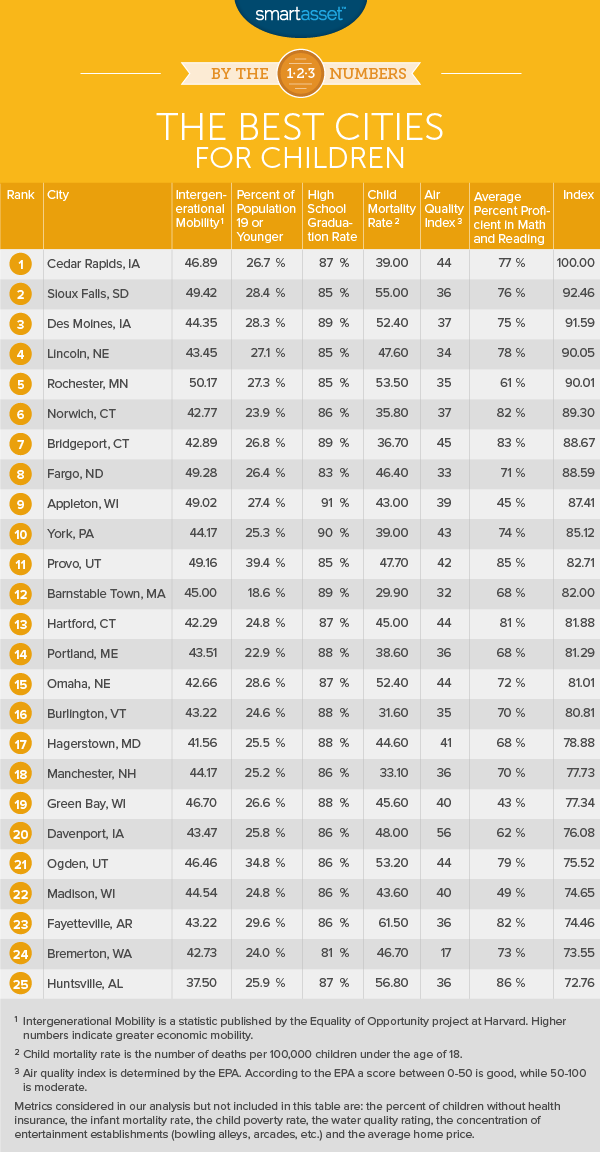
The second largest city in the Hawkeye State, Cedar Rapids is America’s best city for children and by a fairly wide margin. The primary reason for the city’s top ranking is its schools. They graduate 87% of students. 80% of the area’s students test as proficient in math and 74% in reading and language arts.
Cedar Rapids also has the fourth lowest child poverty rate of any major metro in the U.S. About 11% of children in the Cedar Rapids area live below the poverty line. That’s half the average among the 200 largest U.S. metros.
Sioux Falls, South Dakota
Located in the southeast corner of South Dakota, Sioux Falls has been growing rapidly in recent years thanks to its strong economy and low cost of living. Those factors both contribute to the city’s high rate of intergenerational mobility.
Researchers at Harvard found that children born in the 25th percentile of earners in the Sioux Falls area will, on average, rank in the 49th percentile as adults. That is the second highest rate of economic upward-mobility of any metro area in the country.
Des Moines, Iowa
The Iowa capital is the country’s third best city for children. The metro area has the nation’s 17th highest high school graduation rate at 89%. The best performing public school district in the area is the Johnston Community School District. 92% of students in Johnston’s public schools tested as proficient in math.
Lincoln, Nebraska
This Nebraska city rates extremely well for environmental quality and children’s health. It is also generally a very affordable place to live. According to data from the U.S. Census Bureau, the median home value in Lincoln is less than $150,000. That’s good news for budget-conscious parents who want to buy an affordable home with plenty of space for the little ones to run wild.
Rochester, Minnesota
According to data from the Harvard “Equality of Opportunity” project, children in Rochester, Minnesota enjoy the highest level of economic mobility of any major metropolitan area in the U.S. While parents should love the idea that their children have a great chance of economic ascension in Rochester, kids in Med City have a reason to rejoice as well.
SmartAsset’s research found that 35 out of every 1,000 businesses in the Rochester area are kid-friendly entertainment venues. That’s the seventh highest concentration of any major U.S. city. According to the U.S. Census Bureau, the area is home to nine bowling alleys and two arcades.
Norwich, Connecticut
A child’s health and safety is the top concern for most parents and on that front the Norwich metro area, which includes the city of New London, rates very well. The area’s child mortality rate ranks among the ten lowest in the U.S.
Bridgeport, Connecticut
On average, schools in the Bridgeport metro area (which includes Stamford and Norwalk) rate very well, with graduation rates of near 90% and proficiency in math and reading over 80%. In the Norwalk School District, for example, 85% of students graduate from high school, 82% of students are proficient in math and 78% are proficient in language arts.
One exception to this is the Bridgeport Public School District, which is the largest district in the region. Proficiency in the Bridgeport School District is around 50% in both reading and math, while the graduation rate is 67%. Thus, while the metro area as a whole rates well for children, it is important to consider where exactly in the area your children will attend school.
Fargo, North Dakota
Over the past decade and a half, the unemployment rate in Fargo has remained several percentage points lower than the national average. That isn’t just good for working adults, it also benefits children. Thanks in part to the economic opportunities provided by the strong regional economy, Fargo ranks third in the country for economic mobility and has the 12th lowest child poverty rate.
Appleton, Wisconsin
Appleton is one of the “Fox Cities” in central Wisconsin. While Appleton itself has a population of around 76,000, the metropolitan area has a population of about 230,000. Kids in Appleton should have no problem finding ways to pass the time (assuming they can bum a ride from their parents).
The area has nine bowling alleys, four arcades and one of the country’s best minor league baseball venues. That adds up to the fifth highest concentration of kid-friendly entertainment options of any major metro area.
York, Pennsylvania
Though York itself is quite small, with a population just over 40,000, the metro area has 437,000 people according to the U.S. Census Bureau. The region’s schools rate especially well, with a graduation rate of 90% and high levels of proficiency in math and reading.
Data & Methodology
To find the best cities for children, SmartAsset looked at data on children’s health, education and quality of life in every U.S. metro area with a population greater than 200,000 people. We considered 13 factors in all, as described below.
To gauge the schools in a metro area, we looked at the metro-wide graduation rate, weighting each school district’s graduation rate based on the size of the student body. We also considered the percentage of students proficient in math and the percentage of students proficient in reading and language arts.
Next, we looked at data on health and environmental factors. We considered the infant mortality rate (deaths per 100,000 births) and child mortality rate (deaths per 100,000 children age 18 or younger). We looked at the percentage of children that do not have health insurance in each metro. To gauge environmental quality, we considered each metro’s average EPA air quality index rating for the year 2014. We also looked at the frequency of water quality violations in each metro.
Lastly, we considered several economic and quality-of-life metrics. We looked at the child poverty rate in each metro and the intergenerational mobility (a measure of economic opportunity created by researchers at Harvard). To gauge the cost of living and cost of raising a child in each metro, we looked at the median home value. We also considered the percentage of each metro’s population that is under the age of 20 and the number of kid-friendly entertainment establishments per 1,000 businesses in each metro area.
After gathering the data, we ranked every metro on each of the thirteen factors. We then averaged those rankings. The two environmental factors received half-weight and all other factors received full weight. Finally, we indexed that average, with scores ranging from 0 to 100. The metro with the best ranking received a 100.
Data on the graduation rate, math proficiency and reading proficiency in each metro comes from the U.S. Department of Education. Data on the infant mortality rate, child mortality rate, percentage of children without insurance and water quality comes from countyhealthrankings.org.
Data on the population percentage of children, the poverty rate, the concentration of entertainment establishments and the median home value come from the U.S. Census Bureau. Data on the average air quality comes from the EPA. Data on the intergenerational mobility in each city comes from Harvard’s Equality of Opportunity Project.
Read the 2016 version of SmartAsset’s study of the best places for children.
Questions about our study? Contact us at blog@smartasset.com.
Photo credit: ©iStock.com/damircudic