
When looking to sell their house, most owners probably want to make a profit and sell the home for more than they paid for it. But the selling price isn’t the only factor to consider, there are hidden costs when it comes to selling a home. And if it takes a long time to sell a house or if the closing costs are exorbitant, the math may change on how much money the seller gets to pocket. We considered these factors and others when determining the best cities to sell a house.
Find out: How much home can you afford?
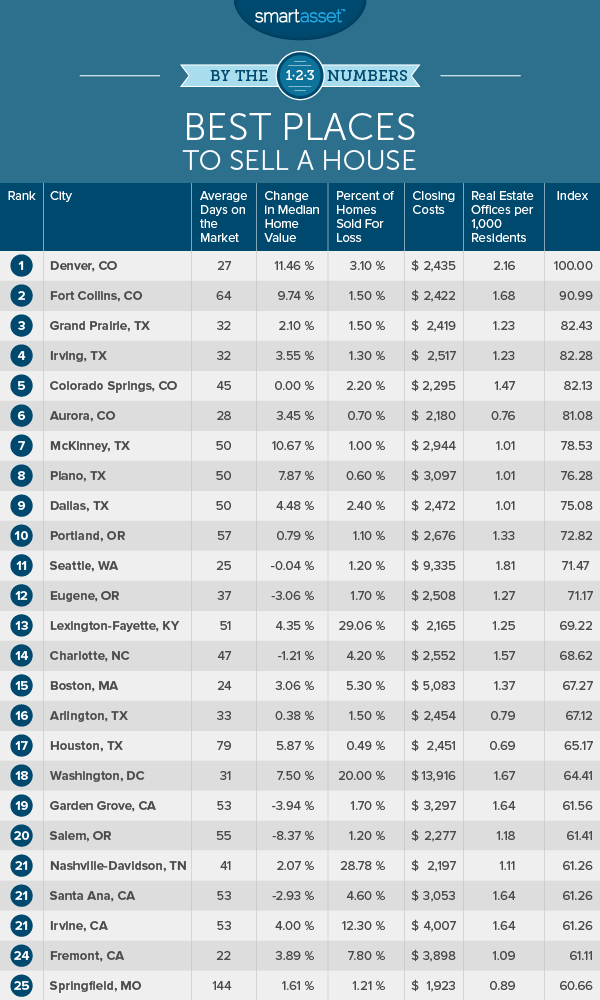
In order to find the best cities to sell a house, we considered five factors. We looked at the change in median home value, the percent of homes in the area sold at a loss, the average number days a home sits on the market, the closing costs and the number of real estate offices per 1,000 residents. Read the data and methodology section below to get a better understanding of how we used our data to create our ranking.
Key Findings
- Two states race – Two states, Colorado and Texas, claimed nine out of the top 10 best places to sell a house. If you’re looking to sell your home and you reside in one of those states, you may be in luck.
- Tough sell in the Northeast – There’s only one Northeast city in our top 25. One reason for that is that closing costs tend to be higher in the Northeast region. Boston, the aforementioned representative, has the third-highest closing costs in the top 25.
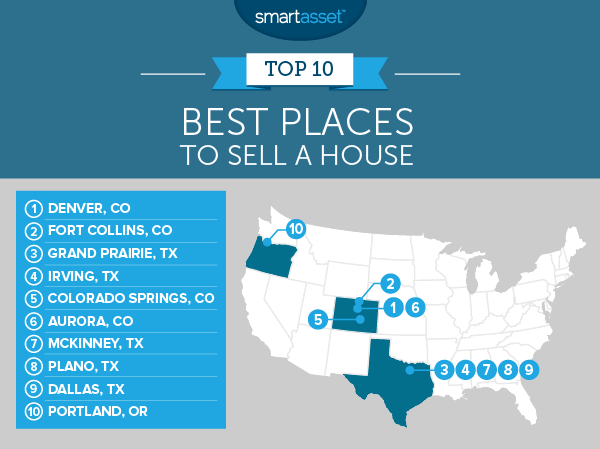
1. Denver, Colorado
We recently found that Denver is the best city for homeowners so we weren’t surprised to discover that it’s also the best place to sell a home. Denver scores in the top 10 in three different metrics. Specifically, it has top 10 scores for change in median home value, average days on the market and real estate offices per 1,000 residents. Denver sellers will want to be aware that closing costs in the city are on the high side. Average closing costs in Denver are $2,435. Denver ranked 51st in that metric.
2. Fort Collins, Colorado
Fort Collins sellers may have to wait a bit longer than their Denver counterparts to sell their houses. Homes in Fort Collins sit on the market for an average of 63 days, as compared to 27 days in Denver. But Fort Collins sellers should sleep well knowing they’ll likely be able to sell their homes for a profit. Only 1.5% of homes here are sold for a loss.
3. Grand Prairie, Texas
Selling your home in Grand Prairie shouldn’t be too difficult. Grand Prairie homes sit on the market for an average of 32 days, so you shouldn’t spend too much of your valuable time waiting for a buyer to pop up. Just 1.5% of homes in Grand Prairie sell for a loss so you’re likely to make a profit, too. However that profit margin may be slim. Median home values in Grand Prairie rose by only 2.1% from 2011 to 2015.
4. Irving, Texas
Irving comes in right behind Grand Prairie, scoring only 0.15 fewer points on our index. The two Texas cities have similar scores but Irving ends up falling just short due to higher average closing costs ($2,517 compared to $2,419). In fact, Irving’s closing costs rank 65th in the study.
5. Colorado Springs, Colorado
Colorado Springs comes in fifth for best places to sell a house. Given that Colorado Springs has some of the lowest taxes in America, it’s not too surprising that people are looking to move here. This city has the second-lowest average closing costs in the top 10 and the second-highest number of real estate offices per 1,000 residents.
6. Aurora, Colorado
If you are a homeowner in Aurora looking to sell, the odds may be in your favor. Median home values are up 3.45% from 2011 to 2015, and only 0.7% of homes are sold for a loss. Plus, Aurora also has the lowest average closing costs in the top 10 ($2,180). That’s also the 12th-lowest in the study overall. However finding help selling your home in Aurora may be more difficult than in other cities. It has the fewest real estate offices in the top 10.
7. McKinney, Texas
McKinney starts off a chain of three northeast Texas cities in our top 10. With a population of around 150,000, McKinney is the smallest city to crack our top 10. But this small city is packed with value. McKinney residents saw median home values shoot up over 10.6% from 2011 to 2015. That rising value means that there’s significantly less risk in taking a loss on selling a home here. Our data shows that 1% of homes in McKinney are sold at a loss.
8. Plano, Texas
Situated between McKinney and Dallas is Plano, Texas, the eighth-best city to sell a house. With its low price-to-rent ratio, Plano is one of the best cities to buy a home. It’s even less likely to sell a home at a loss in Plano than it is in McKinney. Just 0.6% of homes here sell for a loss. For a clearer picture that means if 200 homes being sold in Plano, only one of these would be expected to sell for a loss. However, one downside of the selling process in Plano is that it may take a little while to get a home here off the market. Our data shows that homes in Plano sit on the market for an average of 50 days.
9. Dallas, Texas
Selling your home in Dallas is a lot like selling your home in Plano or McKinney. The home sits on the market for a relatively long time (50 days on average) but you can expect to make some money once it sells. Median home values in Dallas rose 4.48% from 2011 to 2015. That’s the 21st-largest change in the country.
10. Portland, Oregon
Portland, Oregon narrowly beat two other Northwest cities – Seattle and Eugene, Oregon – to close out the top 10. If you are new to the home selling process, Portland is not a bad place to be. The city has 1.33 real estate offices per 1,000 residents. That’s the fourth-highest rate in the top 10 and the 30th-highest rate in the study. One potential drawback to selling in Portland is that the city has the third-highest average closing costs in the top 10 at $2,676.
Data and Methodology
In order to rank the best places to sell a house, we looked at data on 161 cities with populations greater than 150,000 across five factors. Specifically we looked at the following five factors:
- Change in median home value from 2011 to 2015. Data comes from the U.S. Census Bureau’s 2015 and 2011 5-Year American Community Surveys.
- Average days on the market. This is how many days a home sits on the market in each city on average. Data comes from SmartAsset’s healthiest housing markets hash station.
- Percentage of homes sold for a loss. Data comes from SmartAsset’s healthiest housing markets hash station.
- Average closing costs. Data comes from SmartAsset’s closing cost hash station.
- Number of real estate establishments per 1,000 residents. Data on real estate establishments comes from the U.S. Census Bureau’s 2014 County Business Patterns Survey. Population data comes from the U.S. Census Bureau’s 2015 American 5-Year American Community Survey.
We ranked each city across each factor, giving double weight to median home value change and single weight to all other factors. We then averaged those rankings giving each city a score based on those average rankings. The city with the best score received a score of 100 and the city with the worst score received a 0.
Questions about our study? Contact us at press@smartasset.com.
Photo credit: ©iStock.com/jhorrocks